OIH CHART
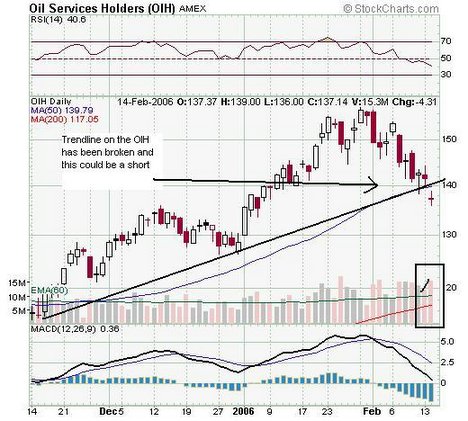 The OIH has broken the trendline as well as the 50 dma. Volume was heavy on this selloff and this could be a short candidate.
posted by Gordengekko at 8:23 AM
![]()
![]()
Stock Market News, Breakouts, Swing Trades, Stocks in Play, Mojo plays, Position Trades, Options and Daytrades
The OIH has broken the trendline as well as the 50 dma. Volume was heavy on this selloff and this could be a short candidate.
posted by Gordengekko at 8:23 AM
![]()
![]()
Disclaimer: This website may include stock market analysis. Any ideas or opinions expressed by us is for informational purposes. Trade at your own financial risk as we assume no responsibility for your investing decisions in the markets.


0 Comments:
Post a Comment
<< Home